Hello,
I am struggling with geom_density when groups consist on fewer than 3 elements.
For a group of 1 element, the density plot consists on a single line of length 1. For a group of 2 elements, this is a rectangle of height 0.5.
Since this does not depends on the y scale, the interpretation of the area under the curves breaks down. This problem becomes obvious when changing coordinates on the x axis (eg unit conversion).
This reproducible example illustrates my point.
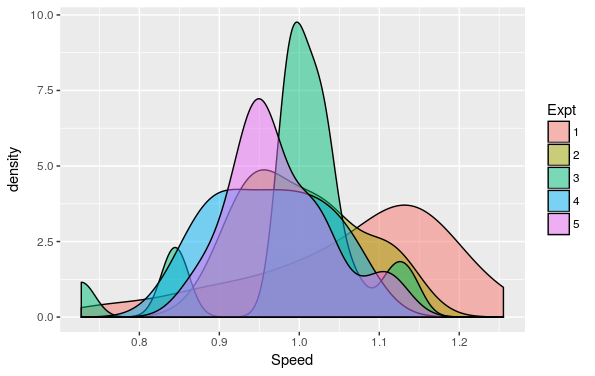
This is the density of the measurements of Speed, for the 5 experiments. Each consists on 20 runs.
library(tidyverse)
library(MASS)

michelson %>%
  ggplot(aes(x = Speed, fill = Expt)) +
  geom_density(alpha = 0.5)

The density of the measurements, for the 5 experiments when we re-normalize the speed. As expected, the only changes are in the axis texts.
michelson %>%
  mutate(Speed = Speed / mean(Speed)) %>%
  ggplot(aes(x = Speed, fill = Expt)) +
  geom_density(alpha = 0.5)
The problem arises when the groups are small,
so we modify the data for the last group to consist on only two runs.
michelson_modif <- michelson
michelson_modif$Expt[83:100] <- 2

michelson_modif %>%
  ggplot(aes(x = Speed, fill = Expt)) +
  geom_density(alpha = 0.5)

michelson_modif %>%
  mutate(Speed = Speed / mean(Speed)) %>%
  ggplot(aes(x = Speed, fill = Expt)) +
  geom_density(alpha = 0.5)

The two graphs are no longer similar.
Do I miss something here? Is it possible to force the behaviour of geom_density to be similar (ie smooth curves) for all the groups, regardless of the number of elements in them?
Thanks a lot!
Hello,
I am struggling with
geom_densitywhen groups consist on fewer than 3 elements.For a group of 1 element, the density plot consists on a single line of length 1. For a group of 2 elements, this is a rectangle of height 0.5.
Since this does not depends on the y scale, the interpretation of the area under the curves breaks down. This problem becomes obvious when changing coordinates on the x axis (eg unit conversion).
This reproducible example illustrates my point.
This is the density of the measurements of
Speed, for the 5 experiments. Each consists on 20 runs.The density of the measurements, for the 5 experiments when we re-normalize the speed. As expected, the only changes are in the axis texts.
The problem arises when the groups are small,
so we modify the data for the last group to consist on only two runs.
The two graphs are no longer similar.
Do I miss something here? Is it possible to force the behaviour of
geom_densityto be similar (ie smooth curves) for all the groups, regardless of the number of elements in them?Thanks a lot!