Visualizzazione post con etichetta function. Mostra tutti i post
Visualizzazione post con etichetta function. Mostra tutti i post
martedì 28 aprile 2009
Tips from the R-help list : shadow text in a plot and bumps charts
Stumbling across the R-help mailing-list I found, as often happens, two threads in the spirit of this blog (of course, since they come from the list, the quality is higher): here you can find a function allowing a shadow outline style for a text in a plot. From here you can follow an interesting thread depicting how to produce bumps charts in R.
giovedì 11 dicembre 2008
Tips from Jason
I want to thank Jason Vertrees for the following collection of useful tips!
(1) Use ~/.Rprofile for repeated environment initialization
(2) Ever have the problem of a large data frame only being displayed across 40% of your terminal window? Then, you can resize the R display to fit the size of your terminal window. Use the following "wideScreen" function:
(3) Get familiar with colorspace. For example, if you need to color data points across a range, you can easily do:
(4) Given an N-dimensional data set, (m instances in N dimensions), find the K-nearest neighbors to a given row/instance/point:
(5) A _VERY_ useful tip is to show the users the vast difference in speed between using for, apply, sapply, mapply and tapply. A for loop is typically very slow, where the ?apply family is great. You can use the apply vs for-loop in the neighbors function above with a timer on a large set to show the difference.
(6) Another useful tip, also in neighbors is generating difference vectors and their lengths:
(1) Use ~/.Rprofile for repeated environment initialization
(2) Ever have the problem of a large data frame only being displayed across 40% of your terminal window? Then, you can resize the R display to fit the size of your terminal window. Use the following "wideScreen" function:
# define wideScreen

wideScreen <- function() {

options(width=as.integer(Sys.getenv("COLUMNS")));

}

#

# Test wideScreen

#

a <- rnorm(100)

a

wideScreen()

# notice how the data fill the screen

a
(3) Get familiar with colorspace. For example, if you need to color data points across a range, you can easily do:
##

## lut.R -- small function that returns a cool pallete of nColors

##

require(colorspace)

lut <- function(nColors=20) {

return(hex(HSV(seq(0, 360, length=nColors)[-nColors], 1, 1)));

}

# Now use lut.

plot( rnorm(100), col=lut(100)[1:100] )

# Now use just a range; use colors near purple; pretty

# much like gettins subsections of rainbow.colors()

plot( rnorm(30), col=lut(100)[71:100] )
(4) Given an N-dimensional data set, (m instances in N dimensions), find the K-nearest neighbors to a given row/instance/point:
##

## neighbors -- find and return the K closest neighbors to "home"

##

neighbors <- function( dat, home, k=10 ) {

theHood <- apply( dat, 1, function(x) sqrt(sum((x-home)**2)))

return(order(theHood)[1:k] )

}

# Use it.  Create a random 10x10 matrix and find which rows

# in D are closest (Euclidean-wise) to row 1.

d <- matrix( rnorm(100), nrow=10, ncol=10)

neighbors(d, d[1,], k=3)
(5) A _VERY_ useful tip is to show the users the vast difference in speed between using for, apply, sapply, mapply and tapply. A for loop is typically very slow, where the ?apply family is great. You can use the apply vs for-loop in the neighbors function above with a timer on a large set to show the difference.
(6) Another useful tip, also in neighbors is generating difference vectors and their lengths:
# the difference vector between two vectors is very easy,

c <- a -b

# now the vector length (how far apart in Euclidean space these two points are)

sqrt(sum(c**2))mercoledì 3 dicembre 2008
Retrieving the author of a script
I know that the best/recommended way to manage the authoring of R code consists in building a package containing a DESCRIPTION file.
Nevertheless, I wrote a very basic function retrieving the name of the authors of a script (or any text file) if these names are written within the first three rows of the file (easily changeable) with this format:
##
## Author:Pinco Palla, Paolino Paperino, Topo Gigio
##
The function:
Nevertheless, I wrote a very basic function retrieving the name of the authors of a script (or any text file) if these names are written within the first three rows of the file (easily changeable) with this format:
##
## Author:Pinco Palla, Paolino Paperino, Topo Gigio
##
The function:
catch.the.name <- function(filename="myscript.R"){

require(gdata)

str <- scan(filename, what='character', nlines=3, sep="\t", quiet=TRUE)

author <- grep("Author:([^ ]+)", str, value=T)

author <-sub('^.*Author:', "", author)

author <-strsplit(author,",")

author <- trim(author)

return(author[[1]])

}
giovedì 17 maggio 2007
Quick and dirty function for descriptive statistics
desc <- function(mydata) {
require(e1071)
quantls <- quantile(x=mydata, probs=seq(from=0, to=1, by=0.25))
themean <- mean(mydata)
thesd <- sd(mydata)
kurt <- kurtosis(mydata)
skew <- skewness(mydata)
retlist <- list(Quantiles=quantls, Mean=themean,
StandDev=thesd,Skewness=skew, Kurtosis=kurt)
return(retlist)
}
# example
exampledata <- rnorm(10000)
summary(exampledata)
desc(exampledata)
mercoledì 2 maggio 2007
ls() improved!
This marvelous little function shows all objects in the current workspace
by mode, class and 'size'! Thanks to Bendix Carstensen!
by mode, class and 'size'! Thanks to Bendix Carstensen!
lls <- function (pos = 1, pat = "")

{

  dimx <- function(dd) if (is.null(dim(dd)))

  length(dd)

  else dim(dd)

  lll <- ls(pos = pos, pat = pat)

  cat(formatC("mode", 1, 15), formatC("class", 1, 18),

  formatC("name",1, max(nchar(lll)) + 1), "size\n-----------------------------------------------------------------\n")

  if (length(lll) > 0)

  {

    for (i in 1:length(lll))

    {

    cat(formatC(eval(parse(t = paste("mode(", lll[i],

    ")"))), 1, 15), formatC(paste(eval(parse(t = paste("class(",

    lll[i], ")"))), collapse = " "), 1, 18), formatC(lll[i],

    1, max(nchar(lll)) + 1), " ", eval(parse(t = paste("dimx(", lll[i], ")"))), "\n")

    }

  }

}
giovedì 26 aprile 2007
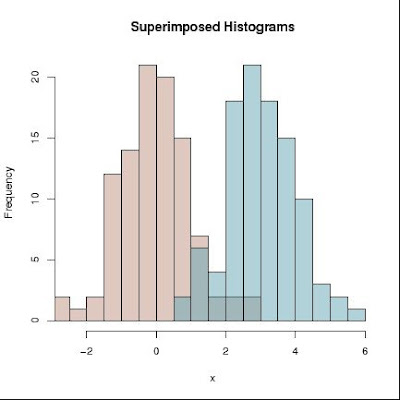
How to Superimpose Histograms
Function inspired by the code of Martin Maechler found on the R-List at http://tolstoy.newcastle.edu.au/R/help/06/06/30059.html
superhist2pdf <- function(x, filename = "super_histograms.pdf",
dev = "pdf", title = "Superimposed Histograms", nbreaks ="Sturges") {
junk = NULL
grouping = NULL
for(i in 1:length(x)) {
junk = c(junk,x[[i]])
grouping <- c(grouping, rep(i,length(x[[i]]))) }
grouping <- factor(grouping)
n.gr <- length(table(grouping))
xr <- range(junk)
histL <- tapply(junk, grouping, hist, breaks=nbreaks, plot = FALSE)
maxC <- max(sapply(lapply(histL, "[[", "counts"), max))
if(dev == "pdf") { pdf(filename, version = "1.4") } else{}
if((TC <- transparent.cols <- .Device %in% c("pdf", "png"))) {
cols <- hcl(h = seq(30, by=360 / n.gr, length = n.gr), l = 65, alpha = 0.5) }
else {
h.den <- c(10, 15, 20)
h.ang <- c(45, 15, -30) }
if(TC) {
plot(histL[[1]], xlim = xr, ylim= c(0, maxC), col = cols[1], xlab = "x", main = title) }
else { plot(histL[[1]], xlim = xr, ylim= c(0, maxC), density = h.den[1], angle = h.ang[1], xlab = "x") }
if(!transparent.cols) {
for(j in 2:n.gr) plot(histL[[j]], add = TRUE, density = h.den[j], angle = h.ang[j]) } else {
for(j in 2:n.gr) plot(histL[[j]], add = TRUE, col = cols[j]) }
invisible()
if( dev == "pdf") {
dev.off() }
}
# How to use the function:
d1 = rnorm(1:100)
d2 = rnorm(1:100) + 4
# the input object MUST be a list!
l1 = list(d1,d2)
superhist2pdf(l1, nbreaks="Sturges")

Iscriviti a:
Commenti (Atom)