SELECT
ID,
makeline(Geometry) AS geom
FROM Birds
GROUP BY ID
2 Dec 2014
QspatiaLite Use Case: Connect Points with Same ID with Line Using the QspatiaLite Plugin
Another short example illustrating the effectiveness of geoprocessing with SpatiaLite, using the great QGIS-plugin QspatialLite.
We have a point-layer with an ID column ("Birds"), with each ID occuring twice, each ID representing an individual. The Ids should be used as start- & end-nodes for the connecting lines. Note that this also would apply if there were more than two points - then the same query could be used to connect all bird individual's points to a line by the order in each group!
We want each set of points, grouped by ID, to be connected. This is easily achieved by importing the points to a SpatiaLite-DB with the QspatiaLite plugin and running a very simple query:
Load the result to QGIS and that's it!
1 Dec 2014
QspatiaLite Use Case: Find Dominant Species and Species Count within Sampling Areas Using the QspatiaLite Plugin
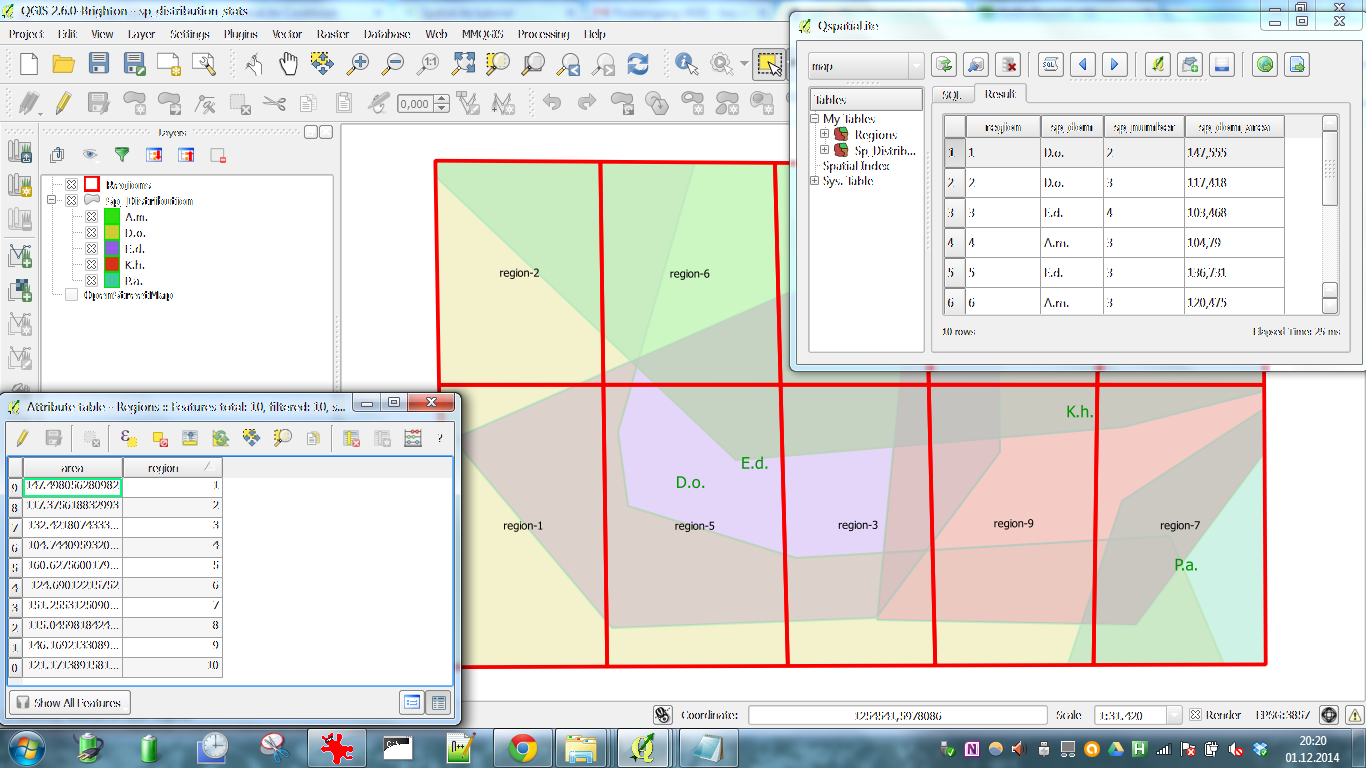
This blogpost shows how to find the dominant species and species counts within sampling polygons. The Species-layer that I'll use here is comprised of overlapping polygons which represent the distribution of several species. The Regions-layer represents areas of interest over which we would like to calculate some measures like species count, dominant species and area occupied by the dominant species.
Since QGIS now makes import/export and querying of spatial data easy, we can use the spatiaLite engine to join the intersection of both layers to the region table and then aggregate this intersections by applying max- and count-function on each region. We'll also keep the identity and the area-value of the species with the largest intersecting area.
For the presented example I'll use
Regions, which is a polygon layer with a areas of interest
Species, which is a polygon layer with overlapping features, representing species
Do the calculation in 2 easy steps:
Import the layers to a spatiaLite DB with the Import function of the plugin (example data: HERE)
Run the query. For later use you can load this table to QGIS or export with the plugin's export button.
Addendum:
If you wish to calculate any other diversity measures, like Diversity- or Heterogenity-Indices, you might just run the below query (which actually is the subquery from above) and feed the resulting table to any statistic-software!
The output table will contain region's IDs, each intersecting species and the intersection area.
The intersection area, which is the species' area per polygon, is the metric that would be used for the calculation of diversity / heterogenity measures, etc. of regions!
I tested this on
QGIS 2.6 Brighton
with the QspatiaLite Plugin installed
Since QGIS now makes import/export and querying of spatial data easy, we can use the spatiaLite engine to join the intersection of both layers to the region table and then aggregate this intersections by applying max- and count-function on each region. We'll also keep the identity and the area-value of the species with the largest intersecting area.
For the presented example I'll use
Do the calculation in 2 easy steps:
SELECT
t.region AS region,
t.species AS sp_dom,
count(*) AS sp_number,
max(t.sp_area) / 10000 AS sp_dom_area
FROM (
SELECT
g.region AS region, s.species AS species,
area(intersection(g.Geometry, s.Geometry)) AS sp_area
FROM Regions AS g JOIN Sp_Distribution AS s
ON INTERSECTS(g.Geometry, s.Geometry)
) AS t
GROUP BY t.region
ORDER BY t.region
Addendum:
If you wish to calculate any other diversity measures, like Diversity- or Heterogenity-Indices, you might just run the below query (which actually is the subquery from above) and feed the resulting table to any statistic-software!
The output table will contain region's IDs, each intersecting species and the intersection area.
The intersection area, which is the species' area per polygon, is the metric that would be used for the calculation of diversity / heterogenity measures, etc. of regions!
SELECT
g.region AS regID,
s.species AS sp,
AREA(INTERSECTION(g.geometry, s.geometry)) AS sp_area
FROM Regions AS g JOIN Sp_Distribution AS s
ON INTERSECTS(g.Geometry,s.Geometry)
ORDER BY regID, sp_area ASC
I tested this on
QspatiaLite Use Case: SpatiaLite Aggregation over Points within Polygons using the QspatiaLite Plugin
Here's a nice example for aggregation of points per polygon areas, which I grabbed from an Answer on SO, by user @Micha. The polygons could be regions of interest, a sampling grid, etc.
Say you want to do maximum, minimum, averages, etc. per polygon using the spatial database SpatiaLite.
You'll first need to import both of your layers into a spatialite DB, called "sensors" (the point layer) here, with a "pollution" column and "SHAPE1" (the polygons) with a "plgnID" column. You can do this easily with the QspatiaLite-plugin "Import" button (example data is HERE).
Now this query will give you various statistics from the sensors for each polygon:
Say you want to do maximum, minimum, averages, etc. per polygon using the spatial database SpatiaLite.
SELECT g.plgnID AS "plgn_ID",
AVG(s.pollution) AS "Average Pollution",
MAX(s.pollution) AS "Maximum Pollution",
COUNT(*) AS "Number of Sensors"
FROM sensors AS s JOIN SHAPE1 AS g
ON contains(g.geometry, s.geometry)
GROUP BY g.plgnID
Subscribe to:
Comments
(
Atom
)


