Visualizzazione post con etichetta density. Mostra tutti i post

venerdì 14 settembre 2007

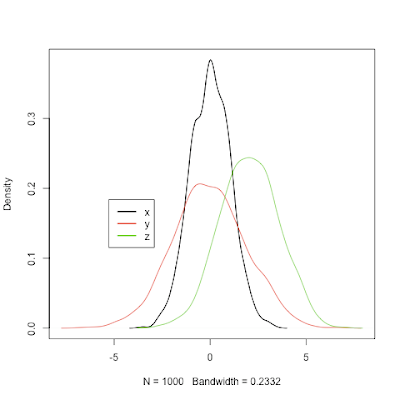
Plotting two or more overlapping density plots on the same graph

This post was updated.
See this thread from StackOverflow for other ways to solve this task.

plot.multi.dens <- function(s)
{
junk.x = NULL
junk.y = NULL
for(i in 1:length(s))
{
junk.x = c(junk.x, density(s[[i]])$x)
junk.y = c(junk.y, density(s[[i]])$y)
}
xr <- range(junk.x)
yr <- range(junk.y)
plot(density(s[[1]]), xlim = xr, ylim = yr, main = "")
for(i in 1:length(s))
{
lines(density(s[[i]]), xlim = xr, ylim = yr, col = i)
}
}
#usage:
x = rnorm(1000,0,1)
y = rnorm(1000,0,2)
z = rnorm(1000,2,1.5)
# the input of the following function MUST be a numeric list
plot.multi.dens(list(x,y,z))
library(Hmisc)
le <- largest.empty(x,y,.1,.1)
legend(le,legend=c("x","y","z"), col=(1:3), lwd=2, lty = 1)
venerdì 11 maggio 2007

Density curve over a histogram

This post was updated.

x <- rnorm(1000)
hist(x, freq = FALSE, col = "grey")
curve(dnorm, col = 2, add = TRUE)

This thread (specifically the Ted Harding answer) from the r-help-list augments the usefulness of this simple tip.

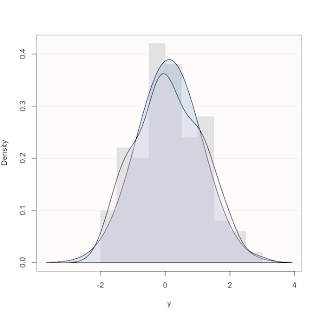
This kind of plots cab be easily produced using the lessR package.

For example, from ?color.density:

library(lessR)
# generate 100 random normal data values
y <- rnorm(100)
# normal curve and general density curves superimposed over histogram
# all defaults
color.density(y)


giovedì 3 maggio 2007

Rotating a distribution plot by 90 degrees

x <- c( rnorm(50,10,2), rnorm(30,20,2) )
y <- 2+3*x + rnorm(80)
d.x <- density(x)
d.y <- density(y)
layout( matrix( c(0,2,2,1,3,3,1,3,3),ncol=3) )
plot(d.x$x, d.x$y, xlim=range(x), type='l')
plot(d.y$y, d.y$x, ylim=range(y), xlim=rev(range(d.y$y)), type='l')
plot(x,y, xlim=range(x), ylim=range(y) )