Function inspired by the code of Martin Maechler found on the R-List at
http://tolstoy.newcastle.edu.au/R/help/06/06/30059.html
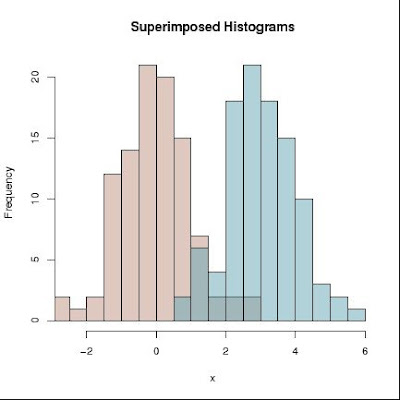
superhist2pdf <- function(x, filename = "super_histograms.pdf",
dev = "pdf", title = "Superimposed Histograms", nbreaks ="Sturges") {
junk = NULL
grouping = NULL
for(i in 1:length(x)) {
junk = c(junk,x[[i]])
grouping <- c(grouping, rep(i,length(x[[i]]))) }
grouping <- factor(grouping)
n.gr <- length(table(grouping))
xr <- range(junk)
histL <- tapply(junk, grouping, hist, breaks=nbreaks, plot = FALSE)
maxC <- max(sapply(lapply(histL, "[[", "counts"), max))
if(dev == "pdf") { pdf(filename, version = "1.4") } else{}
if((TC <- transparent.cols <- .Device %in% c("pdf", "png"))) {
cols <- hcl(h = seq(30, by=360 / n.gr, length = n.gr), l = 65, alpha = 0.5) }
else {
h.den <- c(10, 15, 20)
h.ang <- c(45, 15, -30) }
if(TC) {
plot(histL[[1]], xlim = xr, ylim= c(0, maxC), col = cols[1], xlab = "x", main = title) }
else { plot(histL[[1]], xlim = xr, ylim= c(0, maxC), density = h.den[1], angle = h.ang[1], xlab = "x") }
if(!transparent.cols) {
for(j in 2:n.gr) plot(histL[[j]], add = TRUE, density = h.den[j], angle = h.ang[j]) } else {
for(j in 2:n.gr) plot(histL[[j]], add = TRUE, col = cols[j]) }
invisible()
if( dev == "pdf") {
dev.off() }
}
# How to use the function:
d1 = rnorm(1:100)
d2 = rnorm(1:100) + 4
# the input object MUST be a list!
l1 = list(d1,d2)
superhist2pdf(l1, nbreaks="Sturges")