Visualizzazione post con etichetta overlapping. Mostra tutti i post

venerdì 14 settembre 2007

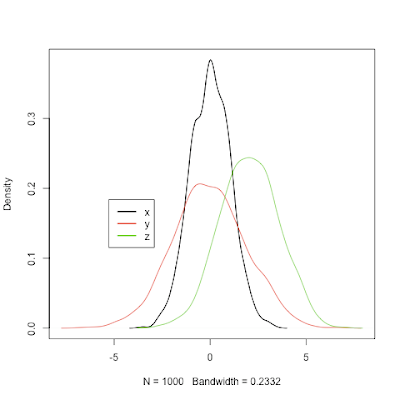
Plotting two or more overlapping density plots on the same graph

This post was updated.
See this thread from StackOverflow for other ways to solve this task.

plot.multi.dens <- function(s)
{
junk.x = NULL
junk.y = NULL
for(i in 1:length(s))
{
junk.x = c(junk.x, density(s[[i]])$x)
junk.y = c(junk.y, density(s[[i]])$y)
}
xr <- range(junk.x)
yr <- range(junk.y)
plot(density(s[[1]]), xlim = xr, ylim = yr, main = "")
for(i in 1:length(s))
{
lines(density(s[[i]]), xlim = xr, ylim = yr, col = i)
}
}
#usage:
x = rnorm(1000,0,1)
y = rnorm(1000,0,2)
z = rnorm(1000,2,1.5)
# the input of the following function MUST be a numeric list
plot.multi.dens(list(x,y,z))
library(Hmisc)
le <- largest.empty(x,y,.1,.1)
legend(le,legend=c("x","y","z"), col=(1:3), lwd=2, lty = 1)

giovedì 26 aprile 2007

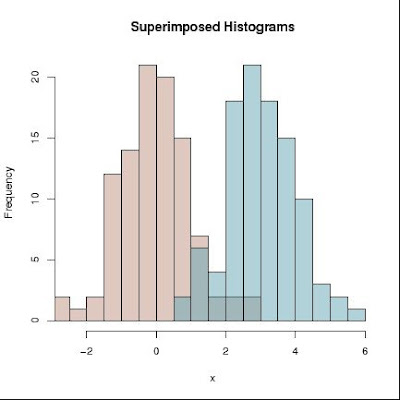
How to Superimpose Histograms

Function inspired by the code of Martin Maechler found on the R-List at http://tolstoy.newcastle.edu.au/R/help/06/06/30059.html
superhist2pdf <- function(x, filename = "super_histograms.pdf",
dev = "pdf", title = "Superimposed Histograms", nbreaks ="Sturges") {
junk = NULL
grouping = NULL
for(i in 1:length(x)) {
junk = c(junk,x[[i]])
grouping <- c(grouping, rep(i,length(x[[i]]))) }
grouping <- factor(grouping)
n.gr <- length(table(grouping))
xr <- range(junk)
histL <- tapply(junk, grouping, hist, breaks=nbreaks, plot = FALSE)
maxC <- max(sapply(lapply(histL, "[[", "counts"), max))
if(dev == "pdf") { pdf(filename, version = "1.4") } else{}
if((TC <- transparent.cols <- .Device %in% c("pdf", "png"))) {
cols <- hcl(h = seq(30, by=360 / n.gr, length = n.gr), l = 65, alpha = 0.5) }
else {
h.den <- c(10, 15, 20)
h.ang <- c(45, 15, -30) }
if(TC) {
plot(histL[[1]], xlim = xr, ylim= c(0, maxC), col = cols[1], xlab = "x", main = title) }
else { plot(histL[[1]], xlim = xr, ylim= c(0, maxC), density = h.den[1], angle = h.ang[1], xlab = "x") }
if(!transparent.cols) {
for(j in 2:n.gr) plot(histL[[j]], add = TRUE, density = h.den[j], angle = h.ang[j]) } else {
for(j in 2:n.gr) plot(histL[[j]], add = TRUE, col = cols[j]) }
invisible()
if( dev == "pdf") {
dev.off() }
}
# How to use the function:
d1 = rnorm(1:100)
d2 = rnorm(1:100) + 4
# the input object MUST be a list!
l1 = list(d1,d2)
superhist2pdf(l1, nbreaks="Sturges")

giovedì 19 aprile 2007

Highlight overlapping area between two curves

This post was updated thanks to Blaž Triglav contribution.
p <- seq(0.2,1.4,0.01)
x1 <- dnorm(p, 0.70, 0.12)
x2 <- dnorm(p, 0.90, 0.12) 
plot(range(p), range(x1,x2), type = "n") 
lines(p, x1, col = "red", lwd = 4, lty = 2) 
lines(p, x2, col = "blue", lwd = 4)
polygon(c(p,p[1]), c(pmin(x1,x2),0), col = "grey")

Below an advanced example (Thanks to Blaž):
p <- seq(54,71,0.1)
x1 <- dnorm(p, 60, 1.5)
x2 <- dnorm(p, 65, 1.5)
par(mar=c(5.5, 4, 0.5, 0.5))
plot(range(p), range(x1,x2), type = "n", xlab="", ylab="", axes=FALSE)
box()
mtext(expression(bar(y)), side=1, line=1, adj=1.0, cex=2, col="black")
mtext("f"~(bar(y)), at=0.265, side=2, line=0.5, adj=1.0, las=2.0, cex=2, col="black")
axis(1, at=60, lab=mu[H[0]]~"=60", cex.axis=1.5, pos=-0.0165, tck=0.02)
axis(1, at=65, lab=mu[H[1]]~"=65", cex.axis=1.5, pos=-0.0165, tck=0.02)
axis(1, at=63.489, lab=y[k][","][zg]~"=63,489", pos=-0.035, tck=0.2)
axis(1, at=63.489, lab="", pos=-0.035, tck=-0.02)
lines(p, x1, col = "black")
lines(p, x2, col = "black")
line3 <- 63.5
polygon(c(line3, p[p<=line3], line3), c(0,x2[p<=line3],0), col = "grey23")
lines(p, x1, col = "black")
line <- 63.489
line1 <- 60
line2 <- 65
abline(v=line, col="black", lwd=1.5, lty = "dashed")
abline(v=line1, col="black", lwd=0.3, lty = "dashed")
abline(v=line2, col="black", lwd=0.3, lty = "dashed")
xt3 <- c(line,p[p>line],line)
yt3 <- c(0,x1[p>line],0)
polygon(xt3, yt3, col="grey")
legend("topright", inset=.05, c(expression(alpha), expression(beta)), fill=c("grey", "grey23"), cex=2)