Visualizzazione post con etichetta plot. Mostra tutti i post

mercoledì 27 luglio 2011

Word Cloud in R

A word cloud (or tag cloud) can be an handy tool when you need to highlight the most commonly cited words in a text using a quick visualization. Of course, you can use one of the several on-line services, such as wordle or tagxedo , very feature rich and with a nice GUI. Being an R enthusiast, I always wanted to produce this kind of images within R and now, thanks to the recently released Ian Fellows' wordcloud package, finally I can!
In order to test the package I retrieved the titles of the XKCD web comics included in my RXKCD package and produced a word cloud based on the titles' word frequencies calculated using the powerful tm package for text mining (I know, it is like killing a fly with a bazooka!).

library(RXKCD)
library(tm)
library(wordcloud)
library(RColorBrewer)
path <- system.file("xkcd", package = "RXKCD")
datafiles <- list.files(path)
xkcd.df <- read.csv(file.path(path, datafiles))
xkcd.corpus <- Corpus(DataframeSource(data.frame(xkcd.df[, 3])))
xkcd.corpus <- tm_map(xkcd.corpus, removePunctuation)
xkcd.corpus <- tm_map(xkcd.corpus, content_transformer(tolower))
xkcd.corpus <- tm_map(xkcd.corpus, function(x) removeWords(x, stopwords("english")))
tdm <- TermDocumentMatrix(xkcd.corpus)
m <- as.matrix(tdm)
v <- sort(rowSums(m),decreasing=TRUE)
d <- data.frame(word = names(v),freq=v)
pal <- brewer.pal(9, "BuGn")
pal <- pal[-(1:2)]
png("wordcloud.png", width=1280,height=800)
wordcloud(d$word,d$freq, scale=c(8,.3),min.freq=2,max.words=100, random.order=T, rot.per=.15, colors=pal, vfont=c("sans serif","plain"))
dev.off()

As a second example,  inspired by this post from the eKonometrics blog, I created a word cloud from the description of  3177 available R packages listed at http://cran.r-project.org/web/packages.
require(XML)
require(tm)
require(wordcloud)
require(RColorBrewer)
u = "http://cran.r-project.org/web/packages/available_packages_by_date.html"
t = readHTMLTable(u)[[1]]
ap.corpus <- Corpus(DataframeSource(data.frame(as.character(t[,3]))))
ap.corpus <- tm_map(ap.corpus, removePunctuation)
ap.corpus <- tm_map(ap.corpus, content_transformer(tolower))
ap.corpus <- tm_map(ap.corpus, function(x) removeWords(x, stopwords("english")))
ap.corpus <- Corpus(VectorSource(ap.corpus))
ap.tdm <- TermDocumentMatrix(ap.corpus)
ap.m <- as.matrix(ap.tdm)
ap.v <- sort(rowSums(ap.m),decreasing=TRUE)
ap.d <- data.frame(word = names(ap.v),freq=ap.v)
table(ap.d$freq)
pal2 <- brewer.pal(8,"Dark2")
png("wordcloud_packages.png", width=1280,height=800)
wordcloud(ap.d$word,ap.d$freq, scale=c(8,.2),min.freq=3,
max.words=Inf, random.order=FALSE, rot.per=.15, colors=pal2)
dev.off()

As a third example, thanks to Jim's comment, I take advantage of Duncan Temple Lang's RNYTimes package to access user-generate content on the NY Times and produce a wordcloud of 'today' comments on articles.
Caveat: in order to use the RNYTimes package you need a API key from The New York Times which you can get by registering to the The New York Times Developer Network (free of charge) from here.
require(XML)
require(tm)
require(wordcloud)
require(RColorBrewer)
install.packages(packageName, repos = "http://www.omegahat.org/R", type = "source")
require(RNYTimes)
my.key <- "your API key here"
what= paste("by-date", format(Sys.time(), "%Y-%m-%d"),sep="/")
# what="recent"
recent.news <- community(what=what, key=my.key)
pagetree <- htmlTreeParse(recent.news, error=function(...){}, useInternalNodes = TRUE)
x <- xpathSApply(pagetree, "//*/body", xmlValue)
# do some clean up with regular expressions
x <- unlist(strsplit(x, "\n"))
x <- gsub("\t","",x)
x <- sub("^[[:space:]]*(.*?)[[:space:]]*$", "\\1", x, perl=TRUE)
x <- x[!(x %in% c("", "|"))]
ap.corpus <- Corpus(DataframeSource(data.frame(as.character(x))))
ap.corpus <- tm_map(ap.corpus, removePunctuation)
ap.corpus <- tm_map(ap.corpus, content_transformer(tolower))
ap.corpus <- tm_map(ap.corpus, function(x) removeWords(x, stopwords("english")))
ap.tdm <- TermDocumentMatrix(ap.corpus)
ap.m <- as.matrix(ap.tdm)
ap.v <- sort(rowSums(ap.m),decreasing=TRUE)
ap.d <- data.frame(word = names(ap.v),freq=ap.v)
table(ap.d$freq)
pal2 <- brewer.pal(8,"Dark2")
png("wordcloud_NewYorkTimes_Community.png", width=1280,height=800)
wordcloud(ap.d$word,ap.d$freq, scale=c(8,.2),min.freq=2,
max.words=Inf, random.order=FALSE, rot.per=.15, colors=pal2)
dev.off()


mercoledì 2 febbraio 2011

venerdì 19 marzo 2010

Balloon plot using ggplot2

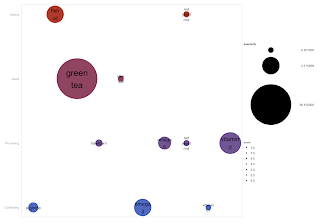
Following Tal Galili example and using part of his code, I want to plot the balloonplot you can see here using R and the excellent ggplot2 package by Hadley Wickham.

### I retrieve the data from the google document you can find here using Tal Galili code:
## I slightly modified Tal code to include popularity stats:
supplement.popularity <- supplements.data[ss,7]
supplements.df <- na.omit(data.frame(supplement.name, supplement.benefits, supplement.popularity, supplement.score)) ## remove rows containing NAs
colnames(supplements.df) <- c("name", "benefits", "popularity", "score")
## For sake of simplicity I select only the cardio metacondition
cardio <- (supplements.df[supplement.benefits=="cardio",])[, -2]
## For reproducibility I add the cardio data.frame so you can use it right away
cardio <- read.table(tc <-textConnection(
" name popularity score
2 'arginine' 1.080 3
10 'vitamin b3' 0.201 3
15 'omega 3' 4.000 3
22 'hawthorn' 0.442 4
27 'red yeast rice' 0.264 4
29 'vitamin d' 6.700 4
31 'omega 6' 2.000 4
35 'green tea' 26.100 5
37 'olive leaf' 0.224 5
41 'fish oil' 4.000 6
43 'red yeast rice' 0.264 6")); close(tc)
cardio$name <- gsub(" ", "\n", cardio$name) #substitute ' ' with '\n' in the names
library(ggplot2)
myTheme <- function(base_size = 10) {
structure(list(
panel.background = theme_rect(size = 1, colour = "lightgray"),
panel.grid.major = theme_blank(),
panel.grid.minor = theme_blank(),
axis.line = theme_blank(),
axis.text.x = theme_blank(),
axis.ticks = theme_blank(),
strip.background = theme_blank(),
strip.text.y = theme_blank(),
legend.background = theme_blank(),
legend.key = theme_blank(),
legend.key.size = unit(1.2, "lines"),
legend.title = theme_text(size = 8, face = "bold", hjust = 0),
legend.position = "right"
), class = "options")
}
s <- ggplot(cardio, aes(name, score)) + xlab(NULL) + ylab(NULL) + myTheme()
s <- s + geom_point( aes(size=popularity, colour=score, fill=score), legend=TRUE) +
scale_y_continuous( breaks=as.numeric(levels(factor(cardio$score))), labels=c("Conflicting", "Promising", "Good", "Strong") ) +
scale_area( breaks=c(min(cardio$popularity),mean(cardio$popularity),max(cardio$popularity)), to=c(4,60) ) +
geom_text(aes(y=cardio$score, label=cardio$name, size=cardio$popularity/90), legend=FALSE)
#pdf("cardio.pdf",height=8,width=12);s;dev.off()
png("cardio.png",height=700,width=1000);s;dev.off()

giovedì 7 gennaio 2010

Scatter plot with 4 axes labels and grid

Ravi from this post (via Revolutions blog) wanted to check the code that produces the left panel of the Figure 3 from this article taken from the current issue of the R Journal. Below my attempt to reproduce the plot:


rv <- seq(1.3, 2.9, .1)
rv <- rv[-grep("1.6", rv)] # remove R version 1.6
pckg.num <- c(110,129,162,219,273,357,406,548,647,739,911,1000,1300,1427,1614,1952)
rv.dates <- c("2001-6-21", "2001-12-17","2002-06-12","2003-05-27",
"2003-11-16","2004-06-05","2004-10-12","2005-06-18","2005-12-16", "2006-05-31",
"2006-12-12","2007-04-12","2007-11-16","2008-03-18","2008-10-18","2009-09-17")
pckg.fit <- lm(pckg.num~rv)
png("CRAN_packages.png")
par(mar=c(7, 5, 5, 3), las=2)
plot(as.POSIXct(rv.dates), pckg.num, xlab="",ylab="",col="red", log="y", pch=19, axes=F)
axis.POSIXct(1, 1:16, rv.dates, format="%Y-%m-%d")
mtext("Date", side=1, line=5, las=1)
axis(2, at=c(100,200,300,400,500,600,800,100,1200,1500,2000))
mtext("Number of CRAN Packages", side=2, line=3, las=3)
axis.POSIXct(3, rv.dates, rv.dates, labels=as.character(rv))
mtext("R Version", side=3, line=3, las=1)
axis(4, pckg.num)
abline(v=as.POSIXct(rv.dates), col="lightgray", lty="dashed")
abline(h=pckg.num, col="lightgray", lty="dashed")
box()
abline(lm(log10(pckg.num)~as.POSIXct(rv.dates)), col="red")
dev.off()

sabato 6 giugno 2009

Two plot with a common legend - base graphics

If you need to share a common legend between two graphs using the ggplot2 package/paradigm take a look at this post from the Learning R blog.
The code below solves the same task using the R base graphics.

png( "2plot1legend.png", width = 480, height = 680)
par(mfrow = c(2, 1), oma = c(0, 0, 0, 2))
plot(hp~mpg, data=mtcars, col=cyl,pch=19)
plot(disp~wt, data=mtcars, col=cyl,pch=19)
par(xpd=NA)
#legend(locator(1), legend=as.numeric(levels(factor(mtcars$cyl))), pch=19, col= as.numeric(levels(factor(mtcars$cyl))) )
legend(x=5.6, y=690, legend=as.numeric(levels(factor(mtcars$cyl))), pch=19, col= as.numeric(levels(factor(mtcars$cyl))) )
dev.off()


martedì 28 aprile 2009

Tips from the R-help list : shadow text in a plot and bumps charts

Stumbling across the R-help mailing-list I found, as often happens,  two threads in the spirit of this blog (of course, since they come from the list, the quality is higher): here you can find a function allowing  a shadow outline style for a text in a plot. From here you can follow an interesting thread depicting how to produce bumps charts in R.

martedì 31 marzo 2009

Multiple plot in a single image using ImageMagick

Sometimes you need to add several plots/images either by row or by column to a single page/sheet.
If you generate all your plot with R base graphics you can easily accomplished the task using the par() function, e.g., using par(mfrow=c(2,2)) and then drawing 4 plots of your choice.
However, if you need to create a single image build up from different sources, e.g. external images, plots not compatible with R base graphics, etc. , you can create/retrieve the single images and then merge them together using the tools from the Unix (Linux, Mac OS X, etc.) ImageMagick suite.

## Example
# we generate some random plot
require(seqLog)
## the first plot is taken from the seqLogo help ( ?seqLogo )
## I selected this example on purpose because the seqLogo function is based on the grid graphics
and is coded in such a way that doesn't allow the use of the par() function
mFile <- system.file("Exfiles/pwm1", package="seqLogo")
m <- read.table(mFile)
pwm <- makePWM(m)
png("seqLogo1.png", width=400, height=400)
seqLogo(pwm)
dev.off()
## totally unrelated
png("plot1.png", width=400, height=400)
plot(density(rnorm(1000)))
dev.off()

Then you can type:
system("convert \\( seqLogo1.png plot1.png +append \\) \\( seqLogo1.png plot1.png +append \\) -background none -append final.png")

Remember that in R you have to start escape character with '\' !

Or, alternatively, from the command line:
convert \( seqLogo1.png plot1.png +append \) \( seqLogo1.png plot1.png +append \) -background none -append final.png

See man convert and man ImageMagick for the full story.

mercoledì 25 marzo 2009

Alternative implementations using ggplot2

Here and here, you can find alternative implementations of two plots  (1, 2) I created time ago using R basic graphic. The author recreates the plots taking advantage of the excellent ggplot2 package.

venerdì 23 gennaio 2009

Interesting tip about multicolor title of a plot

I'd like to suggest to take a look at this interesting post about creating a title with multi-coloured words.

mercoledì 21 gennaio 2009

Radar chart

I thank David for the following example of radar chart:

corelations <- c(1:97)
corelation.names <- names(corelations) <- c("Alp12Mn",
"AvrROE", "DivToP", "GrowAPS", "GrowAsst", "GrowBPS", "GrowCFPS",
"GrowDPS", "GrowEPS", "GrowSPS", "HistAlp", "HistSigm", "InvVsSal",
"LevGrow", "Payout5", "PredSigm", "RecVsSal", "Ret12Mn", "Ret3Mn",
"Ret1Mn", "ROE", "_CshPlow", "_DDM", "_EarnMom", "_EstChgs",
"_EstRvMd", "_Neglect", "_NrmEToP", "_PredEToP", "_RelStMd", "_ResRev",
"_SectMom", "AssetToP", "ARM_Pref_Earnings", "AvrCFtoP", "AvrDtoP",
"AvrEtoP", "ARM_Sec_Earnings", "BondSens", "BookToP", "Capt",
"CaptAdj", "CashToP", "CshFlToP", "CurrSen", "DivCuts5", "EarnToP",
"Earnvar", "Earnyld", "Growth", "HistBeta", "IndConc", "Leveflag",
"Leverag", "Leverage", "Lncap", "Momentum", "Payoflag", "PredBeta",
"Ret_11M_Momentum", "PotDilu", "Price", "ProjEgro", "RecEPSGr",
"SalesToP", "Size", "SizeNonl", "Tradactv", "TradVol", "Value",
"VarDPS", "Volatility", "Yield", "CFROI", "ADJUST", "ERC", "RC", "SPX",
"R1000", "MarketCap", "TotalRisk", "Value_AX", "truncate_ret_1mo",
"truncate_PredSigma", "Residual_Returns", "ARM_Revenue",
"ARM_Rec_Comp", "ARM_Revisions_Comp", "ARM_Global_Rank", "ARM_Score",
"TEMP", "EQ_Raw", "EQ_Region_Rank", "EQ_Acc_Comp", "EQ_CF_Comp",
"EQ_Oper_Eff_Comp", "EQ_Exc_Comp")
corelations <- c(0.223, 0.1884, -0.131, 0.1287, 0.0307,
0.2003, 0.2280, 0.1599, 0.2680, 0.2596, 0.3399, 0.0324, 0.0382, -0.173,
-0.177, -0.056, -0.063, 0.2211, 0.0674, -0.023, 0.2641, 0.2369, 0.1652,
-0.023, 0.1070, 0.0791, -0.023, 0.0434, -0.002, -0.001, -0.000, -0.108,
-0.288, 0.1504, -0.127, -0.142, 0.0852, 0, -0.031, -0.320, 0.0785,
0.0465, -0.166, 0.1416, 0.0945, -0.063, 0.1461, -0.305, 0.1215, 0.0776,
0.0449, 0.0823, -0.018, -0.261, -0.318, 0.1194, 0.3151, -0.124, 0.1037,
0.2240, -0.115, 0.1543, 0, 0.1775, -0.153, 0.1194, 0.1407, 0.1047,
0.0926, -0.403, 0.0067, -0.048, -0.136, 0.1068, 0.0381, 0.1878, -0.035,
0.0761, 0.0784, 0, 0, 0, -0.018, 0.1602, 0.0543, 0, -0.013, 0.1439, 0,
0, -0.054, 0.7426, 0.7510, 0.1657, 0.1657, 0.4949, 1.0000)
require(plotrix)
par(ps=6)
radial.plot(corelations, labels=corelation.names,rp.type="p",main="Correlation Radar", radial.lim=c(-1,1),line.col="blue")


lunedì 19 gennaio 2009

Map coordinates to actual pixel locations on a PNG device

Jason emailed me a new tip. Enjoy it!

Use grconvertX and grconvertY to map the X,Y coordinates for an entity on a graphics device to user coordinates. For example if you plotted points to an image and wanted to map those X,Y coordinates to the actual pixel locations on the PNG you would use this family of functions.

#
# Sample R Code for grconvertX and grconvertY
#

# make fake data
tDat <- cbind(rnorm(10), rnorm(10));

#
# Example #1 -- plot them to an X11 window
#
x11();
plot(tDat);
print(paste(grconvertX(tDat[, 1], "user", "device"), grconvertY(tDat[, 2], "user", "device")));

# turn off the x11 device
#dev.off()


#
# Example 2-- Get the pixel coordinates of the data on a PNG image
#
# plot to a PNG
png(file="RTip_coordinates.png", height=1000, width=1000);
plot(tDat);
print( paste(grconvertX(tDat[, 1], "user", "device"), grconvertY(tDat[, 2], "user", "device")));
dev.off()

# Now, go into GIMP or photoshop. At each data point should be at the
# X,Y coordinate listed.

lunedì 5 gennaio 2009

Statistical Visualizations - Part 2

Other 2 plots inspired by this post.

>original
Europe Asia Americas Africa Oceania
1820-30 106487 36 11951 17 33333
1831-40 495681 53 33424 54 69911
1841-50 1597442 141 62469 55 53144
1851-60 2452577 41538 74720 210 29169
1861-70 2065141 64759 166607 312 18005
1871-80 2271925 124160 404044 358 11704
1881-90 4735484 69942 426967 857 13363
1891-00 3555352 74862 38972 350 18028
1901-10 8056040 323543 361888 7368 46547
1911-20 4321887 247236 1143671 8443 14574
1921-30 2463194 112059 1516716 6286 8954
1931-40 347566 16595 160037 1750 2483
1941-50 621147 37028 354804 7367 14693
1951-60 1325727 153249 996944 14092 25467
1961-70 1123492 427642 1716374 28954 25215
1971-80 800368 1588178 1982735 80779 41254
1981-90 761550 2738157 3615225 176893 46237
1991-00 1359737 2795672 4486806 354939 98263
2001-06 1073726 2265696 3037122 446792 185986


png("immigration_barplot_me.png", width = 1419, height = 736)
library(RColorBrewer) # take a look at http://www.personal.psu.edu/cab38/ColorBrewer/ColorBrewer_intro.html
# display.brewer.all()
FD.palette <- c("#984EA3","#377EB8","#4DAF4A","#FF7F00","#E41A1C")
options(scipen=10)
par(mar=c(6, 6, 3, 3), las=2)
data4bp <- t(original[,c(5,4,2,3,1)])
barplot( data4bp, beside=F,col=FD.palette, border=FD.palette, space=1, legend=F, ylab="Number of People", main="Migration to the United States by Source Region (1820 - 2006)", mgp=c(4.5,1,0) )
legend( "topleft", legend=rev(rownames(data4bp)), fill=rev(FD.palette) )
box()
dev.off()


I find this 'bubbleplot' visualization quite interesting; unfortunately the R code I was capable to produce is quite poor and unsatisfactory. Any improvement or suggestion is more than welcome!
Anyway, this is the code:

png("immigration_bubbleplot_me.png", width=1400, height=400)
par(mar=c(3, 6, 3, 2), col="grey85")
mag = 0.9
original.vec <- as.matrix(original)
dim(original.vec) <- NULL
symbols( rep(1:nrow(original),ncol(original)), rep(5:1, each=nrow(original)), circles = original.vec, inches=mag, ylim=c(1,6),fg="grey85", bg="grey20", ylab="", xlab="", xlim =range(1:nrow(original)), xaxt="n", yaxt="n", main="Immigration to the USA - 1821 to 2006", panel.first = grid())
axis(1, 1:nrow(original), labels=rownames(original), las=1, col="grey85")
axis(2, 1:ncol(original), labels=rev(colnames(original)), las=1, col="grey85")
dev.off()


You can find the first part of this 'series' with Yihui contributed code (Thanks again!) here.

martedì 23 dicembre 2008

Statistical Visualizations

Inspired by this interesting post, I decided to reproduce some of the plots using R code.

The data are c & p from here:

>original
Europe Asia Americas Africa Oceania
1820-30 106487 36 11951 17 33333
1831-40 495681 53 33424 54 69911
1841-50 1597442 141 62469 55 53144
1851-60 2452577 41538 74720 210 29169
1861-70 2065141 64759 166607 312 18005
1871-80 2271925 124160 404044 358 11704
1881-90 4735484 69942 426967 857 13363
1891-00 3555352 74862 38972 350 18028
1901-10 8056040 323543 361888 7368 46547
1911-20 4321887 247236 1143671 8443 14574
1921-30 2463194 112059 1516716 6286 8954
1931-40 347566 16595 160037 1750 2483
1941-50 621147 37028 354804 7367 14693
1951-60 1325727 153249 996944 14092 25467
1961-70 1123492 427642 1716374 28954 25215
1971-80 800368 1588178 1982735 80779 41254
1981-90 761550 2738157 3615225 176893 46237
1991-00 1359737 2795672 4486806 354939 98263
2001-06 1073726 2265696 3037122 446792 185986


png("immigration_log_scatter_BW.png", width = 560, height = 480)
par( mar=c(7, 7, 3, 3) )
plot( original$Europe, log="y", type="l", col="grey20", lty=1,
ylim=c(10, 10000000), xlab="Year Interval", ylab="Number of Immigrants Admitted to the United States",
lwd=2, xaxt='n', yaxt='n', mgp=c(4.5,1,0) ) # xaxt='n' an d yaxt='n'- do not show x and y axis
for (i in 2:dim(original)[[2]]){
lines(original[, i], type="l", lty=i, col="grey20")
}
axis(1, 1:dim(original)[[1]], rownames(original), las=2)
axis(2, at=c(10,100,1000,10000,100000,1000000,10000000), labels=c(10,100,1000,10000,100000,1000000,10000000), las=2, tck=1, col="grey85")
box()
legend( 14,400, legend=colnames(original), lty=c(1:5) )
dev.off()


png("immigration_stacked_chart.png", width = 560, height = 480)
library(plotrix)
par( mar=c(6, 6, 3, 3) , las=1)
colori4<-c("yellow", "darkred","green","brown1", "steelblue")
stackpoly( original[, 5:1], col=smoothColors(colori4), border=NA,stack=T, xaxlab=rownames(original),
ylim=c(10,10000000), staxx=TRUE, axis4=F, main="Immigration to the USA - 1821 to 2006" )
legend("topleft", legend=colnames(original), fill=smoothColors(colori4)[5:1] )
dev.off()


lunedì 15 settembre 2008

Fitting text under a plot

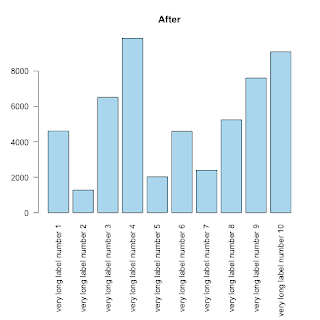
This is, REALLY, a basic tip, but, since I struggled for some time to fit long labels under a barplot I thought to share my solution for someone else's benefit.

As you can see (first image) the labels can not be displayed entirely:

counts <- sample(c(1000:10000),10)
labels <-list()
for (i in 1:10) { labels[i] <- paste("very long label number ",i,sep="")}
barplot( height=counts, names.arg=labels, horiz=F, las=2,col="lightblue", main="Before")


The trick to fit text of whatever dimension is to use the parameter mar to control the margins of the plot.

from ?par:

'mar' A numerical vector of the form 'c(bottom, left, top, right)'
which gives the number of lines of margin to be specified on
the four sides of the plot. The default is 'c(5, 4, 4, 2) + 0.1'.


op <- par(mar=c(11,4,4,2)) # the 10 allows the names.arg below the barplot
barplot( height=counts, names.arg=labels, horiz=F, las=2,col="skyblue", main="After")
rm(op)

martedì 16 ottobre 2007

Duplicate a figure with R

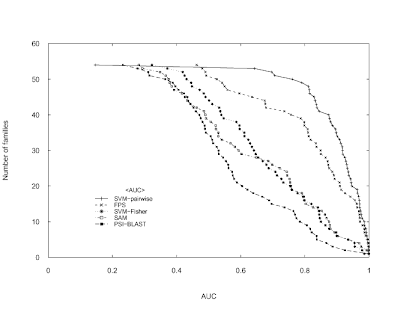
The following code attempts to reproduce the Figure 3 (top) in Liao L, Noble WS.
Combining pairwise sequence similarity and support vector machines for detecting remote protein evolutionary and structural relationships. Journal of computational biology. 2003;10(6):857-68 using only the Base graphics system in R.
Data can be downloaded from here (if it doesn't work, use Google's cache).
I imported the file in a spreadsheet and then I copied & pasted it in R.

jcb.scores = read.delim("clipboard")
attach(jcb.scores)
pdf("recomb_scores.pdf")
par(las =1) # To have horizontal labels for axes 2 and 4
plot(y~sort(SVM.pairwise.ROC, decreasing = TRUE), pch = 3, cex = 0.5,
xlab = "AUC", ylab = "Number of families", axes = FALSE,
xlim = c(0,1), ylim = c(0,60))
lines(y~sort(SVM.pairwise.ROC, decreasing = TRUE), lty = 1)
points(y~sort(FPS.ROC, decreasing = TRUE), pch = 4, cex = 0.5)
lines(y~sort(FPS.ROC, decreasing = TRUE), lty = 2)
points(y~sort(SVM.Fisher.ROC, decreasing = TRUE), pch = 8, cex = 0.5)
lines(y~sort(SVM.Fisher.ROC, decreasing = TRUE), lty = 3)
points(y~sort(SAM.ROC, decreasing = TRUE), pch = 0, cex = 0.5)
lines(y~sort(SAM.ROC, decreasing = TRUE), lty = 4)
points(y~sort(PSI.BLAST.ROC, decreasing = TRUE), pch = 15, cex = 0.5)
lines(y~sort(PSI.BLAST.ROC, decreasing = TRUE), lty = 5)
axis(1, at = seq(0,1,0.2), labels = c(0,0.2,0.4,0.6,0.8,1), tcl = 0.25, pos = 0) # tcl = 0.25 small ticks toward the curve
axis(2, at = c(0,10,20,30,40,50,60), labels=c(0,10,20,30,40,50,60), tcl= 0.25 , pos = 0)
axis(2, at = c(0,10,20,30,40,60), tcl= 0.25,labels = F, pos = 0)
axis(3, tick = T, tcl= 0.25, labels = F, pos = 60)
axis(4, at = c(0,10,20,30,40,50), tcl= 0.25, labels = F, pos = 1)
axis(4, at = c(0,10,20,30,40,60), tcl= 0.25, labels = F, pos = 1)
# To locate the legend interactively
xy.legend = locator(1)
# right-justifying a set of labels: thanks to Uwe Ligges
temp <- legend(xy.legend, legend = c("SVM-pairwise", "FPS","SVM-Fisher", "SAM","PSI-BLAST"), text.width = strwidth("SVM-pairwise"), xjust = 1, yjust = 1, lty = c(1,2,3,4,5), pch = c(3,4,8,0,15), bty = "n", cex = 0.8, title = "")
dev.off()
detach(jcb.scores)


The original image:

My version of the image (not exacly identical but...):

venerdì 14 settembre 2007

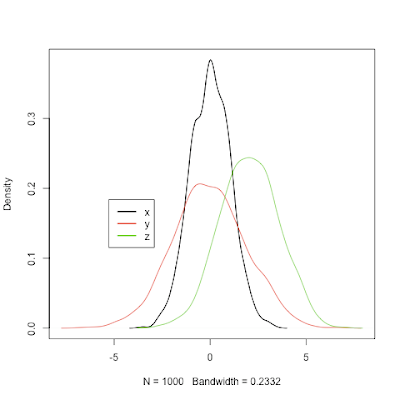
Plotting two or more overlapping density plots on the same graph

This post was updated.
See this thread from StackOverflow for other ways to solve this task.

plot.multi.dens <- function(s)
{
junk.x = NULL
junk.y = NULL
for(i in 1:length(s))
{
junk.x = c(junk.x, density(s[[i]])$x)
junk.y = c(junk.y, density(s[[i]])$y)
}
xr <- range(junk.x)
yr <- range(junk.y)
plot(density(s[[1]]), xlim = xr, ylim = yr, main = "")
for(i in 1:length(s))
{
lines(density(s[[i]]), xlim = xr, ylim = yr, col = i)
}
}
#usage:
x = rnorm(1000,0,1)
y = rnorm(1000,0,2)
z = rnorm(1000,2,1.5)
# the input of the following function MUST be a numeric list
plot.multi.dens(list(x,y,z))
library(Hmisc)
le <- largest.empty(x,y,.1,.1)
legend(le,legend=c("x","y","z"), col=(1:3), lwd=2, lty = 1)

giovedì 2 agosto 2007

Receiver Operating Characteristic (ROC) Curve in ROCR and verification packages

The following VERY basic code shows how to plot a simple ROC Curve both by means of ROCR package and by verification package.

# it allows two different plots in the same frame
par(mfrow = c(1,2))
# plot a ROC curve for a single prediction run
# and color the curve according to cutoff.
library(ROCR)
data(ROCR.simple)
pred <- prediction(ROCR.simple$predictions, ROCR.simple$labels)
perf <- performance(pred,"tpr", "fpr")
plot(perf,colorize = TRUE)
# plot a ROC curve for a single prediction run
# with CI by bootstrapping and fitted curve
library(verification)
roc.plot(ROCR.simple$labels,ROCR.simple$predictions, xlab = "False positive rate",
ylab = "True positive rate", main = NULL, CI = T, n.boot = 100, plot = "both", binormal = TRUE)


venerdì 8 giugno 2007

Back to back historgram

library(Hmisc)
age <- rnorm(1000,50,10)
sex <- sample(c('female','male'),1000,TRUE)
out <- histbackback(split(age, sex), probability=TRUE, xlim=c(-.06,.06), main = 'Back to Back Histogram')
#! just adding color
barplot(-out$left, col="red" , horiz=TRUE, space=0, add=TRUE, axes=FALSE)
barplot(out$right, col="blue", horiz=TRUE, space=0, add=TRUE, axes=FALSE)


martedì 29 maggio 2007

Detecting outliers through boxplots of the features

This function detects univariate outliers simultaneously using boxplots
of the features:

require(dprep)

data(diabetes)

outbox(diabetes,nclass=1)

mercoledì 23 maggio 2007

Scatter plot with axes drawn on the same scale

I'd like to produce some scatter plots where N units on the X axis are > equal to N units on the Y axis (as measured with a ruler, on screen or paper).
x <- sample(10:200,40)
y <- sample(20:100,40)
windows(width = max(x),height = max(y))
plot(x,y)
# try:
plot(x, y, asp = 1)
# or, better:
library(MASS)
eqscplot(x,y)
#or
library(lattice)
xyplot(y ~ x, aspect = "iso")