lunedì 15 settembre 2008

Fitting text under a plot

This is, REALLY, a basic tip, but, since I struggled for some time to fit long labels under a barplot I thought to share my solution for someone else's benefit.

As you can see (first image) the labels can not be displayed entirely:

counts <- sample(c(1000:10000),10)
labels <-list()
for (i in 1:10) { labels[i] <- paste("very long label number ",i,sep="")}
barplot( height=counts, names.arg=labels, horiz=F, las=2,col="lightblue", main="Before")


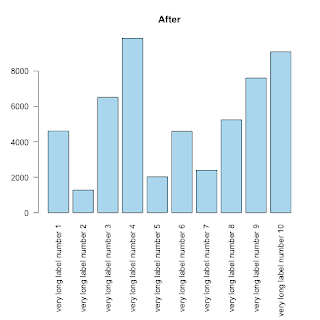
The trick to fit text of whatever dimension is to use the parameter mar to control the margins of the plot.

from ?par:

'mar' A numerical vector of the form 'c(bottom, left, top, right)'
which gives the number of lines of margin to be specified on
the four sides of the plot. The default is 'c(5, 4, 4, 2) + 0.1'.


op <- par(mar=c(11,4,4,2)) # the 10 allows the names.arg below the barplot
barplot( height=counts, names.arg=labels, horiz=F, las=2,col="skyblue", main="After")
rm(op)
lunedì 21 luglio 2008

Bioinformatics career survey 2008

Via Bioinformatics Zen:

giovedì 10 luglio 2008

Parsing problem solved thanks to R-Help mailing list

Recently I had the necessity to parse several HUGE text files (~6M lines ~ 600Mb file size) not formatted in a standard way (so not easy import via scan, read.table etc.).
Because of the size of these files I have to avoid loops and find a way to vectorize my problem.
After several hours spent trying to solve this problem without success, I decided to send an help request to the R-help list. In no time i got the answer to this very problematic (at least for me) exercise :-)

You can read the full story here.

I REALLY love the R-Help mailing list! Thanks Guys!

martedì 6 maggio 2008

Replacing Tabs with spaces and back in VIM

Not specifically R-related.
If you need to remove all the blank spaces from a file and replace them with tabs for easy importing in R, you can do it in VIM in no time. In normal mode type:

:set noexpandtab
:%retab!


The full story here

mercoledì 16 aprile 2008

R installing on Unix/Linux - no root access

Thanks and credit to Joern Toedling for this useful and clear how-to!

From The Bioconductor Digest, Vol 62, Issue 14:
You do not need to have root access to a machine to install your own
versions of R and your favourite packages there. This is how to do it:
1. downloaded the tar.gz of the development version of R from
ftp://ftp.stat.math.ethz.ch/Software/R/
2. uncompress it to a directory you have write access to, say ~/local/R
3. change into the uncompressed directory, ~/local/R/R-devel
4. run "./configure"
5. run "make"
Afterwards you can start R by executing ~/local/R/R-devel/bin/R;
to simplify that either add the bin directory to your path or create an alias for R
You do not need to run "make install" to work with R.
For packages,
1. create a directory in which you want the packages installed, e.g. ~/local/rpacks
2. create an evironment variable R_LIBS that holds the path to that directory, e.g. "setenv R_LIBS=${HOME}/local/rpacks" with that directory and a C-shell (use export with a Bash shell)
This environment variable tells R where to look first for installed packages and where to install packages when using "install.packages" or "biocLite".
R_LIBS is safe to use, since it only extends the path to look for packages and does not replace the default R library path.
I would recommend to add the alias for starting R and the R_LIBS
definition to your shell startup file (~/.cshrc or ~/.bashrc).

mercoledì 27 febbraio 2008

Classification: a quick and dirty example

## Thanks to the UCI repository Magic Gamma telescope data set
magic04 = read.table("http://archive.ics.uci.edu/ml/machine-learning-databases/magic/magic04.data", header = F, sep=",")
# split the data set in test and training set
split.data <- function(data, p = 0.7, s = 666){
set.seed(s)
index <- sample(1:dim(data)[1])
train <- data[index[1:floor(dim(data)[1] * p)], ]
test <- data[index[((ceiling(dim(data)[1] * p)) + 1):dim(data)[1]], ]
return(list(train = train, test = test))
}
dati = split.data(magic04, p = 0.7)
train = dati$train
test = dati$test
# SVM training just for fun
library(e1071)
model <- svm(train[,1:10],train[,11], probability = T)
# prediction on the test set
pred <- predict(model, test[,1:(dim(test)[[2]]-1)], probability = T)
# Check the predictions
table(pred,test[,dim(test)[2]])
pred.prob <- attr(pred, "probabilities")
pred.to.roc <- pred.prob[, 1]
# performance assessment
library(ROCR)
pred.rocr <- prediction(pred.to.roc, as.factor(test[,(dim(test)[[2]])]))
perf.rocr <- performance(pred.rocr, measure = "auc", x.measure = "cutoff")
cat("AUC =",deparse(as.numeric(perf.rocr@y.values)),"\n")
perf.tpr.rocr <- performance(pred.rocr, "tpr","fpr")
plot(perf.tpr.rocr, colorize=T)