giovedì 11 dicembre 2008

Tips from Jason

I want to thank Jason Vertrees for the following collection of useful tips!

(1) Use ~/.Rprofile for repeated environment initialization

(2) Ever have the problem of a large data frame only being displayed across 40% of your terminal window? Then, you can resize the R display to fit the size of your terminal window. Use the following "wideScreen" function:

# define wideScreen
wideScreen <- function() {
options(width=as.integer(Sys.getenv("COLUMNS")));
}
#
# Test wideScreen
#
a <- rnorm(100)
a
wideScreen()
# notice how the data fill the screen
a


(3) Get familiar with colorspace. For example, if you need to color data points across a range, you can easily do:

##
## lut.R -- small function that returns a cool pallete of nColors
##
require(colorspace)
lut <- function(nColors=20) {
return(hex(HSV(seq(0, 360, length=nColors)[-nColors], 1, 1)));
}
# Now use lut.
plot( rnorm(100), col=lut(100)[1:100] )
# Now use just a range; use colors near purple; pretty
# much like gettins subsections of rainbow.colors()
plot( rnorm(30), col=lut(100)[71:100] )


(4) Given an N-dimensional data set, (m instances in N dimensions), find the K-nearest neighbors to a given row/instance/point:

##
## neighbors -- find and return the K closest neighbors to "home"
##
neighbors <- function( dat, home, k=10 ) {
theHood <- apply( dat, 1, function(x) sqrt(sum((x-home)**2)))
return(order(theHood)[1:k] )
}
# Use it. Create a random 10x10 matrix and find which rows
# in D are closest (Euclidean-wise) to row 1.
d <- matrix( rnorm(100), nrow=10, ncol=10)
neighbors(d, d[1,], k=3)


(5) A _VERY_ useful tip is to show the users the vast difference in speed between using for, apply, sapply, mapply and tapply. A for loop is typically very slow, where the ?apply family is great. You can use the apply vs for-loop in the neighbors function above with a timer on a large set to show the difference.

(6) Another useful tip, also in neighbors is generating difference vectors and their lengths:

# the difference vector between two vectors is very easy,
c <- a -b
# now the vector length (how far apart in Euclidean space these two points are)
sqrt(sum(c**2))
mercoledì 3 dicembre 2008

Retrieving the author of a script

I know that the best/recommended way to manage the authoring of R code consists in building a package containing a DESCRIPTION file.
Nevertheless, I wrote a very basic function retrieving the name of the authors of a script (or any text file) if these names are written within the first three rows of the file (easily changeable) with this format:

##
## Author:Pinco Palla, Paolino Paperino, Topo Gigio
##

The function:

catch.the.name <- function(filename="myscript.R"){
require(gdata)
str <- scan(filename, what='character', nlines=3, sep="\t", quiet=TRUE)
author <- grep("Author:([^ ]+)", str, value=T)
author <-sub('^.*Author:', "", author)
author <-strsplit(author,",")
author <- trim(author)
return(author[[1]])
}

giovedì 23 ottobre 2008

R Upgrade on Mac Os X 10.5.5 (Leopard)

To reinstall packages from an old version of R to a new one.
In the old version type:
tmp <- installed.packages()
installedpkgs <- as.vector(tmp[is.na(tmp[,"Priority"]), 1])
save(installedpkgs, file="installed_old.rda")

Install the most recent version of R:
Download the most recent version of R from The Comprehensive R Archive Network (CRAN)
# To wipe the old R version
rm -rf /Library/Frameworks/R.framework /Applications/R.app
rm -rf /Library/Receipts/R-*

Build from source new R version (see this FAQ).
From inside the decompressed R-?.?.? directory type:
# See Section 2.2 of RMacOSX FAQ for the flag description
./configure --with-blas='-framework vecLib' --enable-BLAS-shlib
make
sudo make install

Install BioConductor packages using the biocLite.R installation script.
In an R command window, type the following:
source("http://bioconductor.org/biocLite.R")
chooseBioCmirror()
biocLite()

If you have other Bioconductor packages missing from the old installation:

load("installed_old.rda")
tmp <- installed.packages()
installedpkgs.new <- as.vector(tmp[is.na(tmp[,"Priority"]), 1])
missing <- setdiff(installedpkgs, installedpkgs.new)
for (i in 1:length(missing)) biocLite(missing[i])

Re-install the missing packages from CRAN:
load("installed_old.rda")
tmp <- installed.packages()
installedpkgs.new <- as.vector(tmp[is.na(tmp[,"Priority"]), 1])
missing <- setdiff(installedpkgs, installedpkgs.new)
install.packages(missing)
update.packages()

If you use some package created by Henrik Bengtsson:
source("http://www.braju.com/R/hbLite.R")
hbLite()

If you find your X11 broken after the installation procedure (it happens every time to me, at least on Leopard) install the XQuartz App from here.

Update: If you need to install a recent version of R on old hardware (Power PC G4) and OS (Mac OS X 10.4 here) this post can be useful.

lunedì 15 settembre 2008

Fitting text under a plot

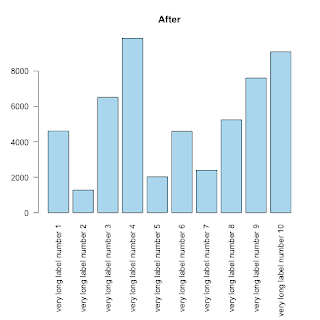
This is, REALLY, a basic tip, but, since I struggled for some time to fit long labels under a barplot I thought to share my solution for someone else's benefit.

As you can see (first image) the labels can not be displayed entirely:

counts <- sample(c(1000:10000),10)
labels <-list()
for (i in 1:10) { labels[i] <- paste("very long label number ",i,sep="")}
barplot( height=counts, names.arg=labels, horiz=F, las=2,col="lightblue", main="Before")


The trick to fit text of whatever dimension is to use the parameter mar to control the margins of the plot.

from ?par:

'mar' A numerical vector of the form 'c(bottom, left, top, right)'
which gives the number of lines of margin to be specified on
the four sides of the plot. The default is 'c(5, 4, 4, 2) + 0.1'.


op <- par(mar=c(11,4,4,2)) # the 10 allows the names.arg below the barplot
barplot( height=counts, names.arg=labels, horiz=F, las=2,col="skyblue", main="After")
rm(op)

lunedì 21 luglio 2008

Bioinformatics career survey 2008

Via Bioinformatics Zen:

giovedì 10 luglio 2008

Parsing problem solved thanks to R-Help mailing list

Recently I had the necessity to parse several HUGE text files (~6M lines ~ 600Mb file size) not formatted in a standard way (so not easy import via scan, read.table etc.).
Because of the size of these files I have to avoid loops and find a way to vectorize my problem.
After several hours spent trying to solve this problem without success, I decided to send an help request to the R-help list. In no time i got the answer to this very problematic (at least for me) exercise :-)

You can read the full story here.

I REALLY love the R-Help mailing list! Thanks Guys!